Blog 4: Microsoft
(1) How do you currently use technology in the classroom, if at all? If so, what technologies? How many students have access to PCs at home?
My students blog (Youth Voices) with others and draft in wikis (individually and collaboratively). We have created VoiceThreads as photo essays and visual letters. My lessons are blogged. We learn to google search and Diigo bookmark in effective ways to find valid information for our writing. We have created memoirs in iMovie that would bring tears to your eyes.
What do we use in 5-8:
Google Docs
PBWorks
Diigo
VoiceThreads
Mapskip
Animoto
Glogster
iMovie
iPhoto
GarageBand
Picassa
Flickr
Blogs (Edublogs, Blogger, Wordpress)
Starting: Ning
The technology is used in school mostly on aging computers. Most of my students have access to someone's computer, but that computer is not always the same computer. We live in a very rural area of high poverty with no fast connection (the school is only T1). Therefore, computers come and go and so do the Internet connections.
Our school connection is SO slow, even at T1.
(2) Is your school leadership supportive of your individual use of technology in teaching and learning?
Our past leadership was not supportive. Our current leadership is supportive, but not technologically literate in Web 2.0.
(3) Where did you get information about ICT in the classroom or about technology (before this PD, of course!)?
I am self-taught. I have ten geeky grandkids and a publishing husband. We all love to geek out. I love the ability students develop to revise and edit, create and collaborate in easy ways using technology. Technology allows us to create, solve our problems, communicate clearly, and share/present with others.
I follow tech leaders on Twitter, belong to many nings, collaborate with teachers and students across the United States, and share my own learning with others.
I was part of the Teacher Leadership Project of 1999 in WA State, and have not stopped learning and sharing (Thanks to the Bill and Melinda Gates Foundation).
(4) Would you be interested in connecting online with other teachers from around the state/region/world with similar interests?
I share and learn at LearnCentral (includes Elluminate), onlineprojects4teachers ning, teachersconnecting, and others. I'm always looking to collaborate with others. It's been great for my students to learn that other kids may be different, but in many ways are the same -- and they all learn at school!
Sheri Edwards
Teaching assignment: Grade 8 Reading and Grades 5-8 Writing ---
Writing Wikis: 5-8 Collaborative with Memphis, Tennessee, Reporters
Assignments Lessons (8 -- others linked on this page)
Thursday, August 20, 2009
Sheri Blog 3: Ideas for next summer
Blog 3: Ideas for next summer PD
- Time to collaborate with our school team
- Time to review, organize, and apply technology that clarifies or applies math concepts
Sheri Blog 2: Robin
Blog 2: What do you want/expect/need from Robin as she observes or visits your school this year?
Are we creating effective monthly collaborative lessons for science/math/writing ? What components would you suggest or have we missed?
Where is a feast of easily used visuals for students (and me, the non-math teacher) to tell the "story" that reflects math/science concepts and vocabulary? We want students to gobble up data and spit it out as valid or biased, with an understanding of why. If I can share visuals that students can interpret in writing using math/science concepts and vocabulary as Sharon and Angie did, we will so help our students develop the thinking skills and language of math and science.
To start:
We'll use the rethinkingmath2 links. Thanks for those!
Sheri: Blog 1: PD Sessions
Blog 1: Ideas for PD Sessions during the school year
I'd like ideas on how I, the non-math teacher, can find and develop the monthly visual ideas to which students develop "stories" which strengthen their math/science conceptual and vocabulary development.
By the way, here's a nice review of the different types of wikis available: Meg's Notebook
I'm a PB Works fan myself -- so rich and so many very easy-to-use features to create an interactive and collaborative learning environment.
Wednesday, August 19, 2009
Sheri's Wednesday 8/19 Journal
Linear Journal 1 ,2 ,3
1. Describe something you learned
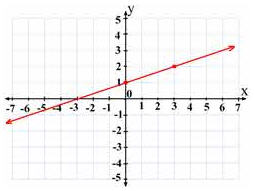
I relearned point slope. I could solve the problem -so YEAH.
I enjoyed learning through Fathom -- highlighting the points and seeing the interactive comparison among the graphs and to the data table. I could hear people choosing their cars based on the data by comparing the visual representations presented by the graphs.
2. What do you still have questions about or would still like to learn?
I'm still learning about box plots. I'm thinking I could use simple graphs and charts of interest to the kids lives for kids to interpret visually and use their vocabulary to explain.
3. What applications are there to classroom practice?
Jama (Science) and I use the Marzano vocabulary strategy in our classrooms. Tracie and I discussed that her seventh grade students could blog for math as an entry task in my classroom since they come to writing right after math.
Again, students can discuss the logic of the "story" in the data of online stories/graphs/ etc.
Some Tech Info:
Online screencast: http://www.screenjelly.com/ "records your screen activity with your voice so you can spread it via Twitter or email"
VoiceThread News:
Online screencast: http://www.screenjelly.com/ "records your screen activity with your voice so you can spread it via Twitter or email"
VoiceThread News:
"over 700,000 historical images from The New York Public Library's Digital Gallery are now freely and instantly available whenever you're creating a VoiceThread"
Two of my class voicethreads:
Two of my class voicethreads:
To Obama (collaborative cross country): http://whatelse.pbworks.com/Yes-We-Can-Serve
PhotoEssay: http://whatelse.pbworks.com/w8-photo-motag
Image Source:
noncommercial use granted
Tuesday, August 18, 2009
Possible Writing Activity
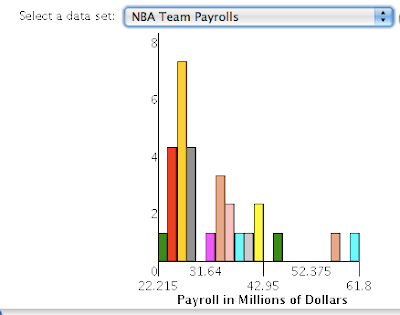
Histograms
What if I change the scale?
What happens to the data if the scale intervals change? Does it matter?
How does this affect how you read and write?
What if I change the scale?

What happens to the data if the scale intervals change? Does it matter?
How does this affect how you read and write?
Steps (Individuals or Teams)
Part 1: Playing with Intervals
Part 2: Reflection on Discussion
Part 3: Playing with Intervals/Wiki Work
Part 4: Peer Share
Part 5: Gist Statement and Application Comment
Part 1: Playing with Intervals:
Choose some of the data sets from this site--- play with the INTERVAL inputs.
http://shodor.org/interactivate/activities/Histogram/?version=1.5.0_19&browser=Mozilla&vendor=Apple_Inc.&flash=10.0.22
Change the interval inputs. Take notes on what you discovered in a table:
| Input | Result | Analysis—What I noticed|
What did you learn from this activity based on the data in your table of changes made?
Keep notes for Part 2.
Part 2: Reflection on Discussion
Read the discussion by students and their mentor here:
http://www.shodor.org/interactivate/discussions/ClassInterval/
What questions do you have?
Do you agree or disagree with the students? Explain with information from
what happened when you changed the intervals in the activity in Part 1.
Keep notes for Part 3.
Part 3: Playing with Intervals/Wiki Work
Choose one of the graphs from Part 1 that you would choose to display to explain the content data (College SAT Math Scores/ NBA Team Payrolls, etc.) you would want to share with others. Take a screenshot of your graph. Upload it to your math Wiki page.
Explain:
What data set did you choose?
What interval did you select?
What title would you give your graph? Why?
What do you think viewers would see in your graph?
Why do you want to show that data information – what is it presenting to the viewer?
Now change your graph with a different interval. Take a screenshot of your graph. Upload it to your math Wiki page.
Explain:
How does this graph differ from your first choice?
What interval did you select?
What title would you give your graph? Why?
What do you think viewers would see in your graph?
Why wouldn’t you choose this graph?
How does this information affect how you read and write when the information includes graphs/histograms?
Part 4: Peer Share
Read another group/individual’s wiki page. Analyze their work and learning. Comment on their wiki page:
What did you notice?
What did you like?
What do you wonder about?
Part 5: Gist Statement and Application
In the comments of this blog post:
Write a gist statement of your learning from this activity.
If you read a graph in your science book, a magazine, a newspaper, or online, what will you look for to understand possible intentions (persuasive strategy) of the data?
How does this information affect how you read and write when the information includes graphs/histograms?
NCTM Standards:
Grades 6-8
- Data Analysis and Probability
- Formulate questions that can be addressed with data and collect, organize, and display relevant data to answer them
- Select and use appropriate statistical methods to analyze data
MathScape Textbook:
Book 1
- [ What Does the Data Say? ] Lesson 6: Across the Ages
Sheri's Tuesday Journal
1. Describe something you learned.
Review:
Our Brains:
Need 20 minute activities
Remember through repetitive timed intervals
Need kinesthetic and visual elements
Store learning in short term memories for 11.3 years before it transfers to long term memory.
and
Formative assessment creates stronger learning.
Conceptual understanding is like brainstorming and discussing in writing class -- it gets the juices flowing, provides background knowledge, and adds vocabulary so that the writing or the math can develop further into actual problems and writing pieces.
2. What do you still have questions about or would still like to learn?
I'd like Mary Jane to email me her power point.
I love math. It's a puzzle.
3. What applications are there to classroom practice?
I already have my class time sorted into 15 or 20 minute activities (high/low activities with active learning like think/pair/share, moving around or actions, art/sketch, and exit/entry cards).
I would like to include surveys, graphs, charts to take/analyze in writing class to extend math understanding.
Monday, August 17, 2009
Monday Sheri 8/17
I love Twitter: grammasheri
1. Describe something you learned.
I learned about another Key Curriculum Press program (other than SketchPad) called Fathom. The great thing: intereactive PC or Mac so kids can manipulate the data to learn how the data works.
I learned about deviation -- which we will review tomorrow.
2. What do you still have questions about or would still like to learn?
I want to continue the deviation.
3. What applications are there to classroom practice?
When the math teacher teaches using the data sets in Fathom, the students can write the story of their data on their wiki in writing class.

Sheri Edwards
Reflect Curiosity and Wonder...
Go Boldly and Scatter Seeds of Kindness...
Subscribe to:
Posts (Atom)